


This article was originally published here in October 2002
All private investors must keep accurate records of their share holdings. The Inland Revenue's Self Assessment scheme makes tracking every penny vital if you are going to account correctly for income and capital gains tax. If you hold only a few shares with just one broker you can probably make do with the statements from the broker along with the consolidated tax certificate that they issue each April. However, if you are like me and have many holdings with several brokers and investment managers you will need a better way of keeping track.
Many people choose to use a finance program like Microsoft Money or Quicken. I have tried these in the past but I have been disappointed. Neither program generates the information that I want in the way that I want it displayed. I find that the infinite flexibility of a spreadsheet program is well worth the small amount of extra effort required in using one to track my investments.
If you own a copy of Microsoft Office then you will have a very capable spreadsheet program called Microsoft Excel. Being a cheapskate, I prefer to use the free office suite from openoffice.org. Its spreadsheet has every function I need. It also loads and saves Excel files so I do not have any data interchange problems with my colleagues.
I use a number of spreadsheets to track interest from bank accounts, dividend payments from my shares and my capital gains and losses. I keep all letters from financial institutions in a pile. Every month I enter all the relevant information from the letters before filing them away. Having all these numbers to hand meant that it took me only 40 minutes to complete my tax return this year.
Simple tasks like that do not make full use of the capabilities of your spreadsheet program. A spreadsheet can do much more than just adding columns of numbers together. It has many useful statistical and financial functions.
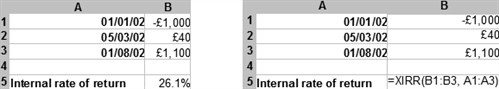
Here is a spreadsheet function that I sometimes find useful. The table on the left shows the spreadsheet as it appears on the screen while the sheet on the right shows the formulas used.
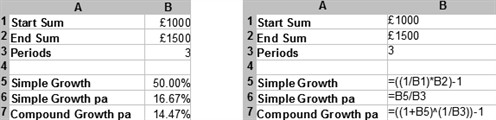
The use of this spreadsheet is in determining equivalent annualised rates of growth. In the example above an investment is promising to turn £1,000 into £1,500 over a period of three years. This is a gain of 50% and one could naively divide 50% by 3 to get an annual growth rate of about 17%. This does not take into account the compounding effect of growth on top of growth from the early years. The formula in B7 takes into account the compounding effect and calculates the "internal" rate of growth. The power of a spreadsheet is that you can type in a starting or ending sum over any period and the rate of return is instantly calculated for you.
The internal rate of growth is very useful when comparing the return of different investments that you have made. Imagine that you invested £1,0000 on the 1st of January, received a dividend of £40 on the 5th of March and sold the investment for £1,100 on the 1st of August. In order to calculate in internal rate of return both Excel and OpenOffice have a function called XIRR. You can see how it works in the table below: